Why CartoDB?
CartoDB is Free Software. Google Maps is good but CartoDB is better and it lets you get under the hood in ways Google Maps doesn’t.
CartoDB is used in a lot of very cool contexts. The parks service uses is to show Realtime Road Closures in National Parks. This Rolling Stones piece is fantastic, and they published the source for that. This is also great: Abortion Access. The code for the abortion map isn’t published anyplace, but Mike Keller and Brian Abelson and Martin Burch all convene at Think Coffee on Mercer every Tuesday night so if you can get halfway there, you can go ask them for help with the last mile.
Points, Shapes and Lines
Mapping Points
“Geocoding” refers to the process of identifying an individual latitude/longitude pair for an address or other location description. To actually plot a location on a map, you need the location’s latitude and longitude. 219 West 40th Street means nothing without coordinates.
Geocoding is actually challenging because there aren’t good, free resources for doing batch jobs, where many addresses are geocoded at once. My Geocoding Tip Sheet includes some helpful resources, but many city data sources actually include coordinates, so double check that, first.
If you’re committed to mapping points, you may need my help geocoding them.
Mapping Lines
No student has ever pitched me a compelling map that features lines rather than shapes or points. I did a project that drew out flight maps showing how far from home every prisoner incarcerated in Florence, CO is, but I pitched that, so it doesn’t count. To draw that map I had to take a crash course in rendering lines. If you’re excited about doing something like this, great! But you’re going to need to install R and walk through Nathan Yau’s tutorial before you do anything else. And that’s not where I’d start learning how to make a map.
Mapping Polygons
Zipcodes, council districts, police precincts – these are all polygons. Most of your maps will be in polygons. These polygons are defined in (usually) one of two specialized file formats – a “Shapefile” or a “KML” file. The syntax of the file types varies, but they contain basically the same information – the polygon called “Bronx CB 04” is defined by this series of lat/lon pairs. My Shapefiles Tip Sheet has some excellent resources for finding shapefiles, especially within New York City.
Often (usually) your data won’t include a shapefile. If you have High School graduation rates by school districts, and you want to map those, you need to find a shapefile that describes the outline of each school district, and then you need to combine that shapefile with your data, by identifying a column that the two tables have in common.
Walking Through It
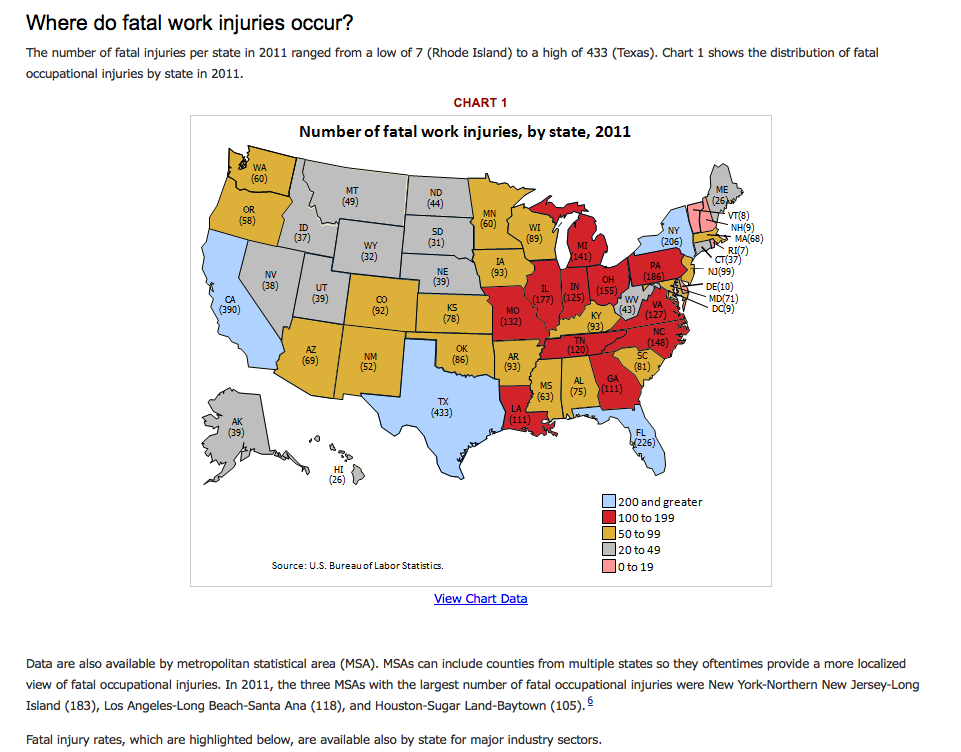
The BLS published this gorgeous map of workplace fatalities a few years ago and I never get tired of using it in class.
More tutorials that you might find helpful:
Discussion: How could we improve on this map?
Hands On
Start with the BLS Data.
Sources:
- 2011 Workplace Fatality Data (via BLS)
- 2011 Population Estimates (via census.gov)
Calculate fatalities per 100,000 residents? =(B1/C1)/100000
Find a US State Shapefile.
Upload both to CartoDB. What do they have in common?
I have two tables: bls_fatality_2011 has data I’d like to map; us_states has outlines of each state in the union. I need a query that will pull the state outlines (the_geom) from us_states and put it into bls_fatality_2011. Here’s that query:
UPDATE bls_fatality_2011
SET the_geom = us_states.the_geom
FROM us_states
WHERE us_states.state = bls_fatality_2011.state
If your table, {data_table} has a column named {column_b} and your geometry table, {shape_table} has a column named {column_a} and the content in {column_a} matches the content in {column_b} your update query will look like this:
UPDATE {data_table}
SET the_geom = {shape_table}.the_geom
FROM {shape_table}
WHERE {shape_table}.{column_a} =  {data_table}.{column_b}
Advanced Queries
Combining Geoms
The problem: you need to combine several polygons or areas into a single area.
Where CartoDB really shines is when you plug into its underlying postGIS database. For instance … you can use ST_Union to merge two shapes (or polygons) into a single shape. For instance, if … hypothetically … you had county by county data on asthma rates in New York State, but only one line for “New York City” rather than data for each borough, and a shapefile with county outlines, you’d need to figure out how to create a single polygon of all five boroughs. Which you’d do about like this:
INSERT INTO ny_counties (county) VALUES ('New York City')
INSERT will change your data by adding rows. This INSERT query adds a new row to your ny_counties table, with “New York City” listed as value in the county column.
Your next step is to figure out how to select only the regions you want to join with ST_Union. You’ll probably use a query like:
SELECT * FROM ny_counties WHERE county IN ('Kings', 'Queens', 'Richmond', 'Bronx', 'New York')
This SELECT query will not alter your data. It will select all the rows in a table called ny_counties where the county name (or the value in the county column) is in the list gieven. This is a sanity check, it will let you see wether or not the next query is going to work. If you’re confident that your SELECT query is selecting exactly the regions that you want to unite, you are ready to join their geometries with ST_Union”
UPDATE ny_counties SET the_geom = (
	SELECT ST_Union(the_geom) FROM ny_counties
	WHERE county IN ('Kings', 'Queens', 'Richmond', 'Bronx', 'New York')
) WHERE county = 'New York City'
This UPDATE query will calculate a polygon that is the “Union” or combined area of all the polygons that represent matching counties, and add that polygon to the the_geom on the row that you added earlier, which has a county value of “New York City”. UPDATE will change your data by altering existing rows based on the WHERE clause. If you were to omit the WHERE clause, the query would change the_geom for every row.
Fancy Number Formats
The problem: you want to show numbers in your info windows but they’re formatted as numbers and you want 1,400 not 1399.9999999.
The solution: Postgres formatting functions. You can tweak the format right in your select query. If your table is bls_fatalities and your numeric column is, say, rate_per_100k, you’d use:
SELECT *, to_char(rate_per_100k, '0D99') AS formatted_rate FROM bls_fatalities
to select all the data in your table (that’s what hte * means – everything), plus a column called formatted_rate that contains formatted decimal values. The formatting string, 0D99 means that there will be at least one digit before the decimal place (“leading 0” is the technical term – 0.54 has a leading 0, .54 does not). A text string like '$999G999D00' would format numbers as dollar amounts with two decimal places shown even if the amount is a whole number. If you’re seeing values like $ ###,###.## that means you need more digits.
To test my work, I find it easier to start by selecting only the column I’m trying to format:
SELECT rate_per_100k, to_char(rate_per_100k, '0D99') AS formatted_rate FROM bls_fatalities
and then when I know I have the text string right, I can use the full query. To format a percent that is stored as a decimal value, you need to actually multiply by 100:
SELECT percent, to_char(percent, '99V99%') AS formatted_percent FROM my_table
Advanced Infowindows
Andrew published a nice rundown on formatting info windows. I cleaned it up some. This isn’t a modest undertaking and in most situations you should make do with what you get out of the box.