Points, Shapes and Lines
Mapping Points
“Geocoding” refers to the process of identifying an individual latitude/longitude pair for an address or other location description. To actually plot a location on a map, you need the location’s latitude and longitude. 219 West 40th Street means nothing without coordinates.
Geocoding is actually challenging because there aren’t good, free resources for doing batch jobs, where many addresses are geocoded at once. My Geocoding Tip Sheet includes some helpful resources, but many city data sources actually include coordinates, so double check that, first.
If you’re committed to mapping points, you may need my help geocoding them.
Mapping Lines
No student has ever pitched me a compelling map that features lines rather than shapes or points. I did a project that drew out flight maps showing how far from home every prisoner incarcerated in Florence, CO is, but I pitched that, so it doesn’t count. To draw that map I had to take a crash course in rendering lines. If you’re excited about doing something like this, great! But you’re going to need to install R and walk through Nathan Yau’s tutorial before you do anything else. And that’s not where I’d start learning how to make a map.
Mapping Polygons
Zipcodes, council districts, police precincts – these are all polygons. Most of your maps will be in polygons. These polygons are defined in (usually) one of two specialized file formats – a “Shapefile” or a “KML” file. The syntax of the file types varies, but they contain basically the same information – the polygon called “Bronx CB 04” is defined by this series of lat/lon pairs. My Shapefiles Tip Sheet has some excellent resources for finding shapefiles, especially within New York City.
Often (usually) your data won’t include a shapefile. If you have High School graduation rates by school districts, and you want to map those, you need to find a shapefile that describes the outline of each school district, and then you need to combine that shapefile with your data, by identifying a column that the two tables have in common.
Walking Through It
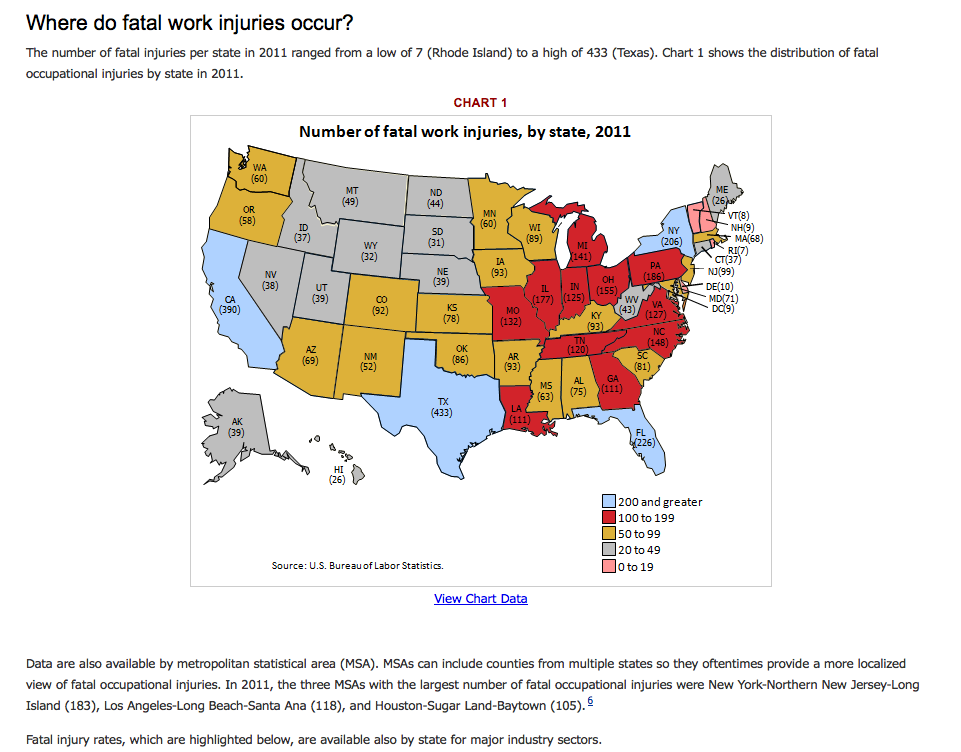
The BLS published this gorgeous map of workplace fatalities a few years ago and I never get tired of using it in class.
Discussion: How could we improve on this map?
Hands On
Start with the BLS Data.
Sources:
- 2011 Workplace Fatality Data (via BLS)
- 2011 Population Estimates (via census.gov)
####Calculate fatalities per 100,000 residents? =(B1/C1)/100000
Find a US State Shapefile.
Upload both to CartoDB. What do they have in common?
Merge them. You can merge your fatality data into your us_states table:
UPDATE us_states
SET bls_fatalities_per_100k = fatalities_per_capita.fatalities_per_capita
FROM fatalities_per_capita
WHERE us_states.name = fatalities_per_capita.state
Or you can merge state outlines into your BLS data table:
UPDATE bls_fatality_2011
SET the_geom = us_states.the_geom
FROM us_states
WHERE us_states.state = bls_fatality_2011.state
Advanced Queries
Where CartoDB really shines is when you plug into its underlying postGIS database. For instance … you can use ST_Union to merge two shapes (or polygons) into a single shape. For instance, if … hypothetically … you had county by county data on asthma rates in New York State, but only one line for “New York City” rather than data for each borough, and a shapefile with county outlines, you’d need to figure out how to create a single polygon of all five boroughs. Which you’d do about like this:
INSERT INTO ny_counties (county) VALUES ('New York City')
This INSERT query will add a new row to your ny_counties table, with “New York City” listed as value in the county column. INSERT will change your data by adding rows.
SELECT * FROM ny_counties WHERE county IN ('Kings', 'Queens', 'Richmond', 'Bronx', 'New York')
This SELECT query will not alter your data. It will select all the rows in a table called ny_counties where the county name (or the value in the county column) is in the list. This is a sanity check, it will let you see wether or not the next query is going to work.
UPDATE ny_counties SET the_geom = (
	SELECT ST_Union(the_geom) FROM ny_counties
	WHERE county IN ('Kings', 'Queens', 'Richmond', 'Bronx', 'New York')
) WHERE county = 'New York City'
This UPDATE query will calculate a polygon that is the “Union” or combined area of all the polygons that represent matching counties, and add that polygon to the the_geom on the row that you added earlier, which has a county value of “New York City”. UPDATE will change your data by altering existing rows based on the WHERE clause. If you were to omit the WHERE clause, the query would change the_geom for every row.
That there are more efficient ways to do all of this, with nested queries, but I think you’re better off doing it in small steps, for now.